
Silverlake's Investment Philosophy
Let The Markets Work For You
The financial markets have rewarded disciplined long-term investors. People expect a positive return on the capital they supply, and historically, public equity and bond markets have provided growth of wealth that has more than offset inflation.

Notes [4]
Respect Market Pricing
Financial science has shown that the market is an effective information-processing machine. Each day, global capital markets transact billions of dollars in trades between buyers and sellers — and the real-time information they bring helps set prices.

Notes [1]
Don’t Try To Outsmart The Markets
The market’s pricing power works against investment fund managers who try to outperform through stock picking or market timing. As evidence, only 18% of US-domiciled equity funds and 15% of fixed income funds survived and outperformed their benchmarks between 2004 and 2023.
Notes [2]
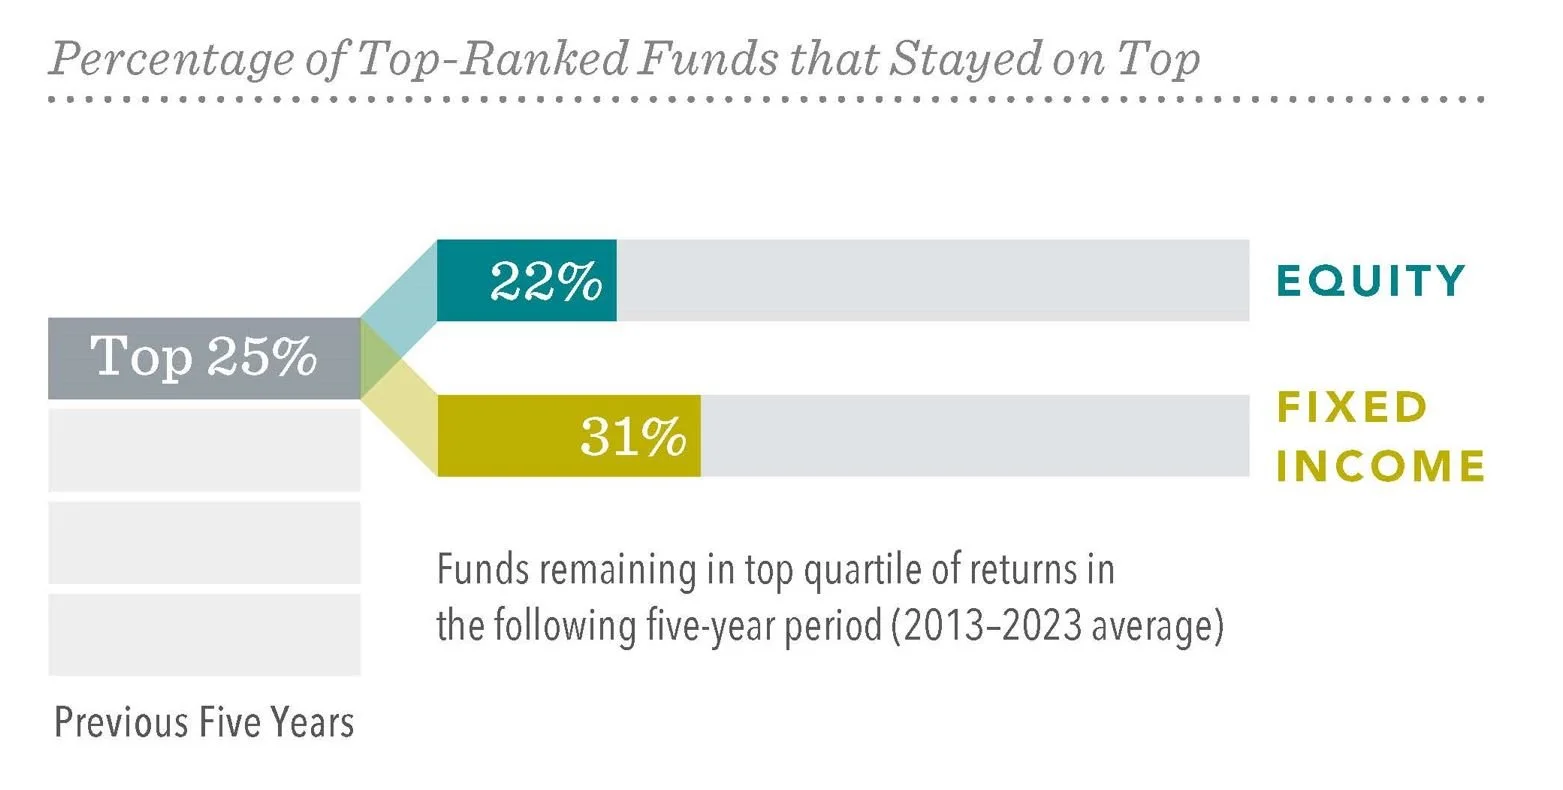
Don’t Chase Past Performance
Some investors select funds based on past returns. But past performance offers little insight into future returns. For example, stocks that have grown to be among the 10 biggest in the US have tended to lag the overall market after reaching that size, failing to maintain their strong performance.

Notes [3]
Target Drivers Of Higher Returns
Academic research into decades of stock and bond returns has identified long-term drivers of outperformance. Investing systematically in asset classes with higher expected returns may lead to improved portfolio performance.

Notes [5]
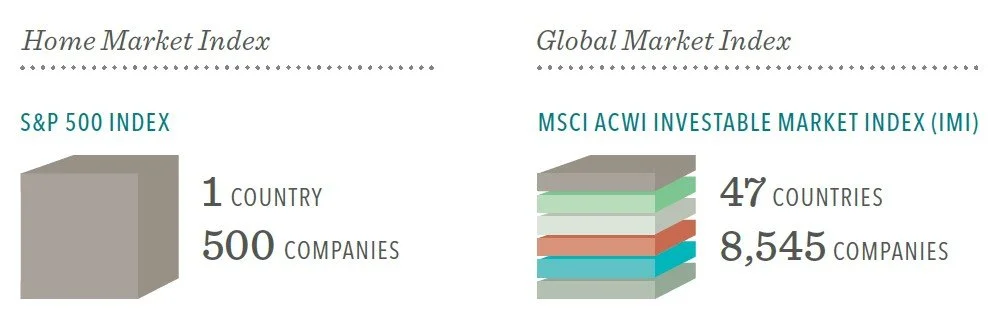
Diversify Broadly
Holding a globally diversified portfolio can broaden your opportunities beyond your home market — putting you in a better position to capture higher returns wherever they appear.
Notes [6]
Avoid Market Timing
Research has shown there’s no reliable way to time the market — targeting the best days to be invested or moving to the sidelines to avoid the worst days. It has also shown the impact of being out of the market even for a short time. Staying invested helps position you to capture long-term gains.

Notes [7]
Manage Your Emotions
Many people struggle to separate their emotions from investing. Markets go up and down and the volatility can be unnerving at times. Reacting to current market conditions may lead to making poor investment decisions.

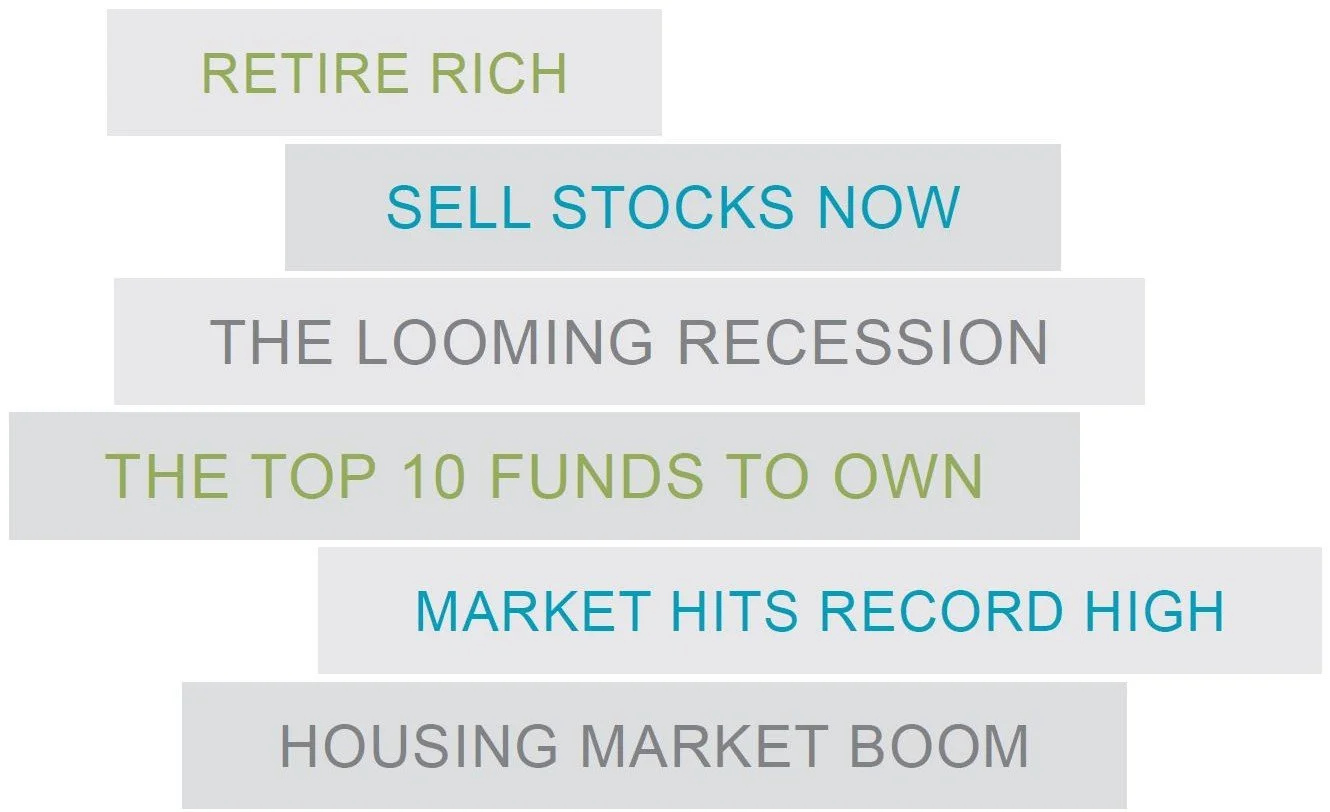
Look Past The Headlines
Daily market news and commentary can challenge your investment discipline. Some messages stir anxiety about the future, while others tempt you to chase the latest investment fad. When headlines unsettle you, consider the source — is it news or entertainment? Tune out the noise and maintain a long-term perspective.
Focus On What You Can Control
A financial advisor can offer expertise and guidance to help you focus on actions that add value. This can lead to a better investment experience.

Notes
Exhibit 1: In USD. Source: Dimensional, using data from Bloomberg LP. Includes primary and secondary exchange trading volume globally for equities. Funds are excluded. Daily averages were computed by calculating the trading volume of each stock daily as the closing price multiplied by shares traded that day. All such trading volume is summed up and divided by 252 as an approximate number of annual trading days.
Exhibit 2: The sample includes funds at the beginning of the 20-year period ending December 31, 2023. Each fund is evaluated relative to its primary prospectus benchmark. Survivors are funds that had returns for every month in the sample period. Each fund is evaluated relative to its primary prospectus benchmark. Winners are funds that survived and outperformed their benchmark over the period. Where the full series of primary prospectus benchmark returns is unavailable, non-Dimensional funds are instead evaluated relative to their Morningstar category index.
Exhibit 3: In USD. Source: Dimensional, using data from CRSP. Includes all US common stocks excluding REITs. Largest stocks identified at the end of each calendar year by sorting eligible US stocks on market capitalization. Ten largest companies by market capitalization. Returns after joining the 10 largest are measured as of the start of the first calendar year after a stock joins the Top 10. Annualized excess return is the difference in annualized compound returns between the stock and the S&P 500 Index over the three-, five-, and 10-year periods, before and after each stock’s initial year-end classification in the Top 10. Three-, five-, and 10-year annualized returns are computed for companies with return data available for the entire three-, five-, and 10-year periods, respectively. The number of firms included in measuring excess returns prior (subsequent) to becoming a Top 10 stock consists of 44 (58) for the three-year period, 43 (55) for the five-year period, and 34 (49) for the 10-year period.
Source (Exhibits 2 and 3): The sample includes funds at the beginning of the 20-year period ending December 31, 2024. Each fund is evaluated relative to its primary prospectus benchmark. Survivors are funds that had returns for every month in the sample period. Winners are funds that survived and outperformed their benchmark over the period. Where the full series of primary prospectus benchmark returns is unavailable, non-Dimensional funds are instead evaluated relative to their Morningstar category index. Data Sample: The sample includes US-domiciled, USD-denominated open-end and exchange-traded funds (ETFs) in the following Morningstar categories. Non-Dimensional fund data is provided by Morningstar. Dimensional fund data is provided by the fund accountant. Dimensional funds or subadvised funds whose access is or previously was limited to certain investors are excluded. Index funds, load-waived funds, and funds of funds are excluded from the industry sample. Morningstar Categories (Equity): Equity fund sample includes the following Morningstar historical categories: Diversified Emerging Markets, Europe Stock, Foreign Large Blend, Foreign Large Growth, Foreign Large Value, Foreign Small/Mid Blend, Foreign Small/Mid Growth, Foreign Small/Mid Value, Global Real Estate, Japan Stock, Large Blend, Large Growth, Large Value, Mid-Cap Blend, Mid-Cap Growth, Mid-Cap Value, Miscellaneous Region, Pacific/Asia ex-Japan Stock, Real Estate, Small Blend, Small Growth, Small Value, Global Large-Stock Blend, Global Large-Stock Growth, Global Large-Stock Value, and Global Small/ Mid Stock. Morningstar Categories (Fixed Income): Fixed income fund sample includes the following Morningstar historical categories: Corporate Bond, High-Yield Bond, Inflation-Protected Bond, Intermediate Core Bond, Intermediate Core-Plus Bond, Intermediate Government, Long Government, Muni California Intermediate, Muni California Long, Muni Massachusetts, Muni Minnesota, Muni National Intermediate, Muni National Long, Muni National Short, Muni New Jersey, Muni New York Intermediate, Muni New York Long, Muni Ohio, Muni Pennsylvania, Muni Single State Intermediate, Muni Single State Long, Muni Single State Short, Muni Target Maturity, Short Government, Short-Term Bond, Ultrashort Bond, Global Bond, and Global Bond-USD Hedged.
Index Data Sources: Index data provided by Bloomberg, MSCI, Russell, FTSE Fixed Income LLC, and S&P Dow Jones Indices LLC. Indices are not available for direct investment. Their performance does not reflect the expenses associated with management of an actual portfolio. US-domiciled mutual funds and US-domiciled ETFs are not generally available for distribution outside the US.
US-domiciled mutual funds and US-domiciled ETFs are not generally available for distribution outside the US.
Exhibit 4: In USD. US Small Cap is the CRSP 6–10 Index. US Large Cap is the S&P 500 Index. US Long-Term Govt Bonds is the Bloomberg US Government Bond Index Long. US Treasury Bills is the IA SBBI US 30 Day TBill TR USD. US Inflation is measured as changes in the US Consumer Price Index. Data presented in the Growth of a Dollar chart is hypothetical and assumes reinvestment of income and no transaction costs or taxes. The chart is for illustrative purposes only and is not indicative of any investment.
Exhibit 5: Relative price is measured by the price-to-book ratio; value stocks are those with lower price-to-book ratios. Profitability is measured as operating income before depreciation and amortization minus interest expense scaled by book.
Exhibit 6: Number of holdings and countries for the S&P 500 Index and MSCI ACWI IMI (All Country World IMI Index) as of December 31, 2024. International investing involves special risks, such as currency fluctuation and political instability. Investing in emerging markets may accentuate these risks.
Exhibit 7: In USD. For illustrative purposes. Best performance dates represent end of period (November 28, 2008, for best week; April 22, 2020, for best month; June 22, 2020, for best three months; and September 4, 2009, for best six months). The missed best consecutive days examples assume that the hypothetical portfolio fully divested its holdings at the end of the day before the missed best consecutive days, held cash for the missed best consecutive days, and reinvested the entire portfolio in the Russell 3000 Index at the end of the missed best consecutive days. Data presented in the Growth of $1,000 exhibit is hypothetical and assumes reinvestment of income and no transaction costs or taxes. The data is for illustrative purposes only and is not indicative of any investment.. Dimensional Fund Advisors LP is an investment advisor registered with the Securities and Exchange Commission. Investment products: • Not FDIC Insured • Not Bank Guaranteed • May Lose Value Dimensional Fund Advisors does not have any bank affiliates.
Bloomberg data provided by Bloomberg. MSCI data © MSCI 2025, all rights reserved. Frank Russell Company is the source and owner of the trademarks, service marks, and copyrights related to the Russell Indexes. FTSE fixed income indices © 2025 FTSE Fixed Income LLC. All rights reserved. S&P data © 2025 S&P Dow Jones Indices LLC, a division of S&P Global. All rights reserved. CRSP data is provided by the Center for Research in Security Prices, University of Chicago. Treasury bills data provided by Ibbotson Associates via Morningstar Direct. US Consumer Price Index data is provided by the US Department of Labor Bureau of Labor Statistics. Dimensional Fund Advisors LP is an investment advisor registered with the Securities and Exchange Commission. Consider the investment objectives, risks, and charges and expenses of the Dimensional funds carefully before investing. For this and other information about the Dimensional funds, please read the prospectus carefully before investing. Prospectuses are available by calling Dimensional Fund Advisors collect at (512) 306-7400 or at dimensional.com. Dimensional funds are distributed by DFA Securities LLC. Mutual fund investment values will fluctuate, and shares, when redeemed, may be worth more or less than original cost. Diversification neither assures a profit nor guarantees against a loss in a declining market. There is no guarantee investment strategies will be successful. ETFs trade like stocks, fluctuate in market value, and may trade either at a premium or a discount to their net asset value. ETF shares trade at market price and are not individually redeemable with the issuing fund, other than in large share amounts called creation units. ETFs are subject to risks similar to those of stocks, including those regarding short-selling and margin account maintenance. Brokerage commissions and expenses will reduce returns. Investment products: • Not FDIC Insured • Not Bank Guaranteed • May Lose Value Dimensional Fund Advisors does not have any bank affiliates.
This information is not meant to constitute investment advice, a recommendation of any securities product or investment strategy (including account type), or an offer of any services or products for sale, nor is it intended to provide a sufficient basis on which to make an investment decision. Investors should consult with a financial professional regarding their individual circumstances before making investment decisions.
Past performance is no guarantee of future results. Indices are not available for direct investment. Index performance does not reflect the expenses associated with the management of an actual portfolio.
Diversification does not eliminate the risk of market loss. There is no guarantee investment strategies will be successful. This information is for illustrative purposes only. See back page for additional exhibit information and important disclosures.